Category Archives: Troubleshooting

Citrix Netscaler 12.1.50 Saml Issue

Hey,

It’s been a while since i updated my blog, but i thought it would be time to pick it up again.

So i was playing around with the native receiver (workspace app) and SAML/FAS, as i’m having some issues getting this to work, so i wanted to set it up my own little test environment at home.

For that i had to setup some SAML authentication on my Netscaler running build 12.1.50-28.nc and i kept getting an error while trying to add the SAML server

To setup a basic SAML policy we need to add the SAML iDP server which you can do under Citrix Gateway – Policies – Authentication – SAML – Servers – Add

To make the SAML server you need a couple of things

  1. Name
  2. Redirect URL
  3. Single Logout URL
  4. SAML Binding
  5. IDP Certificate Name
  6. Signing Certificate Name
  7. User field
  8. Issuer Name
  9. Signature Algorithm
  10. Digest Method

But whenever i tried to add the server i got the following message
Arguments cannot both be specified [samlIdPCertName, metadataUrl]

I have to admit there have been a lot of GUI issues in the Netscaler lately (Like the Invalid Argument AES256 from last patch) so i jumped into the CLI to see how little i should add before Netscaler would accept it and the GUI would allow me to work with it.

The CLI for adding a SAML server is something like this: add authentication samlAction auth_Okta_saml -samlIdPCertName Okta -samlSigningCertName -samlRedirectUrl “https:///adfs/ls/” -samlUserField “Name ID” -samlIssuerName

But if you don’t prefer the CLI and want to use the CLI, the least amount of configuration i could get the Netscaler to accept and allow me to edit the server in GUI was this: add authentication samlaction auth_Okta_saml -samlIDPCertName Okta -samlSigningCertName Cert -samlredirectUrl https://fqdn

After that i could edit the server and change any setting, so my guess is that the Netscaler got an issue in regards to the Redirect URL

p.s i know the Netscaler is Citrix ADC now, but i love the old name to much, sorry Citrix 🙂

How to troubleshoot network issues with the Netscaler

Hi all,

It´s been a while since my last blog post, but I have been busy at work, working on a very fun XenMobile project.

Last post I promised that I would explain how we can use the built-in tcpdump function in the Netscaler, without having to take a packet capture and open our trusted Wireshark.

I´ve been on a lot of assignments, where I had to setup something for the customer, like a SSL Offload for Outlook Web Access, and once I’ve done the service part, I quickly notice the service is in a downstate as shown in this picture.

Outlook web access service is down

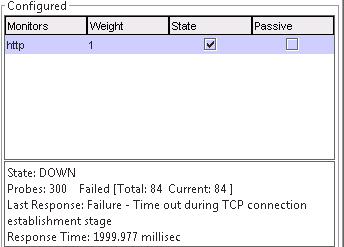
Now we can check why the service is in a downstate by double clicking the service, and checking the monitor

Monitor down, Timeout doing TCP connection establishment stage

This tells me that when the Netscaler tries to make a TCP connection to the service using the monitor HTTP, it sent the packets, but didn´t couldn´t make a proper TCP connection, something is blocking the connection. Since I almost never touch the backend service, like the OWA in this example, I would ask the contact person on site, if they were sure that the subnet IP of the Netscaler is able to communicate with the backend – hence, is there firewall blocking the communication. I often get an answer like “Yeah, we check the firewall and nothing is blocking the traffic, the problem must be on your end”

Now I make sure that I have the correct IP address, that I’m trying to connect to it on the correct port number, if there are a lot of different interface i.e. a lot of different SNIP, I make sure the Netscaler will send the traffic using the  correct SNIP.

Now a way to check that the traffic is flowing like I want it, I could fire up the packet capture on the Netscaler, download the pcap file and run it in my trusted Wireshark, this is a very effective way of debugging, but seeing as this is a simple issue, I can just use the built-in tcpdump function.

I SSH to the Netscaler, change to shell and fire up my nstcpdump.sh
The OWA backend service ran on IP 10.10.200.5, so I want to monitor the traffic flowing from the Netscaler to that IP.
In my shell cmd I enter: nstcpdump.sh dst host 10.10.200.5, this will show me traffic sent to the destination host 10.10.200.5, the output will look like this

output of nstcpdump.sh dst host 10.10.200.5

We can see that 10.10.200.16 is sending a packet to 10.10.200.5, but the ack 0, this means that the Netscaler have not received a reply from destination, and the pattern is the same in the following packets.
Just a note “the first packet sent wouldn´t be able to have an ack number, since the source haven’t communicated with the destination yet.”

The output tells me the follow, the Netscaler is trying to communicate with the backend server from SNIP 10.10.200.16, it´s connecting to the backend from a random TCP number, but the destination port number is 80/http like expected. I can now go back to my contact person, saying that I can see the Netscaler is behaving as I expected.

I would say from experience that 9 out of 10 times the traffic is being blocked by a firewall.
Once we get the service in an UP state, the output of nstcpdump.sh DST host 10.10.200.5 would look like

Service is UP again
Service is UP again

It´s easy to see the difference between a down and up service using nstcpdump.sh

There are lot of other useful filters, but take a look at the CTX article located at http://support.citrix.com/article/CTX118185.

That is all for now, next time we will take a look at XenMobile App Wrapping, I just did a fun job where I had to hack an iOS application, so I could wrap it and upload it to the Citrix AppController.

Take care out there.


How to troubleshoot authentication

Hi,

I can´t count how many times I’ve been told that the Netscaler isn´t letting users log on, so no one can work.

In 99% of the cases it´s not the Netscaler that is failing, but the external authentication service we are using, so unless you work with local users on the Netscaler, then the Netscaler will ask an external authentication server to authenticate an user.

Let us have a look at what happens when an user tries to log on using an AGEE and they fail their login.

Logonfailed

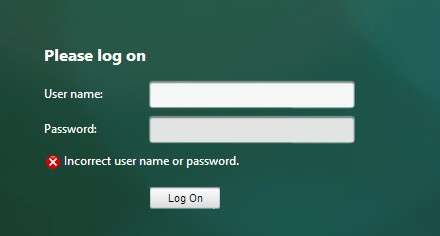
The user gets the message “Incorrect user name or password” When we have to figure out what is going on, we can turn to the auditing – syslog on the Netscaler

Logonfailesyslog


(Click the picture for a larger version of it)


The picture tells us the AAA module had a login_failed for the user mbptest the reason is “External authentication server denied access” this is tell a Netscaler admin, that it wasn´t the Netscaler itself that denied the user access to the system. However, it doesn´t say what authentication server was asked, what the reason for deny is, so the only useful information we got, was that it wasn´t the Netscaler itself.


Now if we want to a much better way to figure out what is going, we can use the aaad.debug module, this module is a pipe, so nothing is saved to disk, but require we do live monitoring of it.


To get access to the aaad.debug we need to use the command line of the Netscaler, so we can go System – diagnostics – command line interface, which will open a console on the Netscaler from the GUI, but it´s rather limited so I much rather start up my trusted SSH client and connect to the Netscaler.


Once we got access to the Netscaler, we have to go into NSCLI (Netscaler Command Line Interface) so type in shell and press enter, this will change the prompt from > to the user@hostname#


Go the /tmp folder using cd /tmp, and try to type ls -l, you will find aaad.debug in this folder, so now we just need to monitor the file, while we do a login, and to do that we can use the command cat, you can find the manual page for cat here http://unixhelp.ed.ac.uk/CGI/man-cgi?cat


So to monitor the aaad.debug, we will use cat aaad.debug, now we will see everything that touches the AAA daemon, ask the user to log on again and follow the authentication.

aaad_debug_ldap_start

We can see that the user mbptest is starting an LDAP authentication against the server 10.10.10.11

aaad_debug_ldap_ssl_bind


The next thing that happens here is the connection to the server is using SSL/TLS, and the connection to the 10.10.10.11 is using SSL (ldaps port 636) then the bind event starts and finally the bind event is successful.

The bind is when the user we use to access the ldap server, so on our LDAP server we added a service account, that is used to access the ldap, now if the bind fails, then no one will be able to log on, because we can´t access the ldap server.

Common issues when bind fails are password expired, the account is logged out of the domain, and account is disabled.

The next that happens is a bind event for the user, where we will check the ldap for the user account, figure out what groups/nested groups the user is member of, and finally ldap will return the result of the bind event

aaad_debug_ldap_user_fail

We can see that the user is located, but the error is invalid credentials (i.e. wrong password)

Therefore, we checked that the Netscaler could communicate with the LDAP server, the service account works (the first bind is successful) but the user is typing in a wrong password.

If we have a primary and a secondary authentication server (like radius and ldap) then the auditing – syslog would still just say, “external authentication server denied access” but using aaad.debug we can check how far into the authentication the users gets.

For the next blog I will talk about using NSTCPDUMP.SH for live packet monitoring without the need for a wireshark.

How to troubleshoot policies in realtime.

Hello,

There is an quick and easy way to see what policies applied in realtime using the command line

If you havn´t had time to check out the nsconmsg command, this post will help you master it.

The command can be used with the AGGE, rewrite and responder policies, and i find that it´s the fastest way to debug what is going on.

The first thing you need to know, is that you have to be in shell mode, for it to work, so after you SSHd into the Netscaler (I prefer to use Putty http://www.chiark.greenend.org.uk/~sgtatham/putty/download.html on Windows and just use the buildin on my Mac)

So after you access to the netscaler, you have to type Shell like this:ShellAccess

After you got access to the shell, you can use nsconmsg, the parameters that i mostly use is the this:

nsconmsg -d current -g pol_hits

When an user logs on to the AGEE, it will display  which authentication policies that was used and the session policies (if the login was successful of course) an output will look like this:

nsconmsg

This picture shows what policies was hit in realtime.

There are a couple of other paramets that are helpful:

nsconmsg –d current | egrep –i rewrite/responder depending if you want check for rewrites or responder policies.

Hopefully this quick post will help Netscaler administrators to debug AGEE, rewrite and responder policies in realtime.

My next blog post will be about authentication troubleshooting in realtime also.