Hi all,
It´s been a while since my last blog post, but I have been busy at work, working on a very fun XenMobile project.
Last post I promised that I would explain how we can use the built-in tcpdump function in the Netscaler, without having to take a packet capture and open our trusted Wireshark.
I´ve been on a lot of assignments, where I had to setup something for the customer, like a SSL Offload for Outlook Web Access, and once I’ve done the service part, I quickly notice the service is in a downstate as shown in this picture.

Now we can check why the service is in a downstate by double clicking the service, and checking the monitor
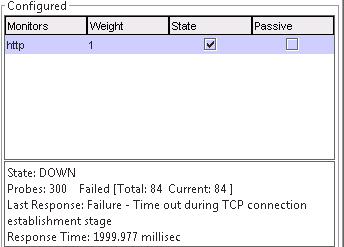
This tells me that when the Netscaler tries to make a TCP connection to the service using the monitor HTTP, it sent the packets, but didn´t couldn´t make a proper TCP connection, something is blocking the connection. Since I almost never touch the backend service, like the OWA in this example, I would ask the contact person on site, if they were sure that the subnet IP of the Netscaler is able to communicate with the backend – hence, is there firewall blocking the communication. I often get an answer like “Yeah, we check the firewall and nothing is blocking the traffic, the problem must be on your end”
Now I make sure that I have the correct IP address, that I’m trying to connect to it on the correct port number, if there are a lot of different interface i.e. a lot of different SNIP, I make sure the Netscaler will send the traffic using the correct SNIP.
Now a way to check that the traffic is flowing like I want it, I could fire up the packet capture on the Netscaler, download the pcap file and run it in my trusted Wireshark, this is a very effective way of debugging, but seeing as this is a simple issue, I can just use the built-in tcpdump function.
I SSH to the Netscaler, change to shell and fire up my nstcpdump.sh
The OWA backend service ran on IP 10.10.200.5, so I want to monitor the traffic flowing from the Netscaler to that IP.
In my shell cmd I enter: nstcpdump.sh dst host 10.10.200.5, this will show me traffic sent to the destination host 10.10.200.5, the output will look like this
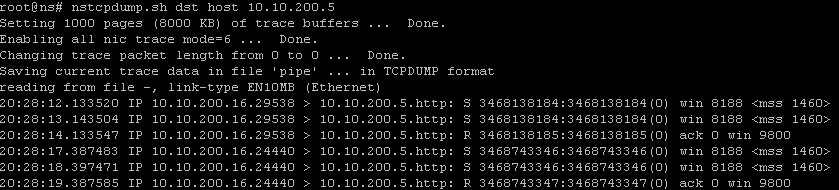
We can see that 10.10.200.16 is sending a packet to 10.10.200.5, but the ack 0, this means that the Netscaler have not received a reply from destination, and the pattern is the same in the following packets.
Just a note “the first packet sent wouldn´t be able to have an ack number, since the source haven’t communicated with the destination yet.”
The output tells me the follow, the Netscaler is trying to communicate with the backend server from SNIP 10.10.200.16, it´s connecting to the backend from a random TCP number, but the destination port number is 80/http like expected. I can now go back to my contact person, saying that I can see the Netscaler is behaving as I expected.
I would say from experience that 9 out of 10 times the traffic is being blocked by a firewall.
Once we get the service in an UP state, the output of nstcpdump.sh DST host 10.10.200.5 would look like

It´s easy to see the difference between a down and up service using nstcpdump.sh
There are lot of other useful filters, but take a look at the CTX article located at http://support.citrix.com/article/CTX118185.
That is all for now, next time we will take a look at XenMobile App Wrapping, I just did a fun job where I had to hack an iOS application, so I could wrap it and upload it to the Citrix AppController.
Take care out there.